Quantifying Banker Success

Overview
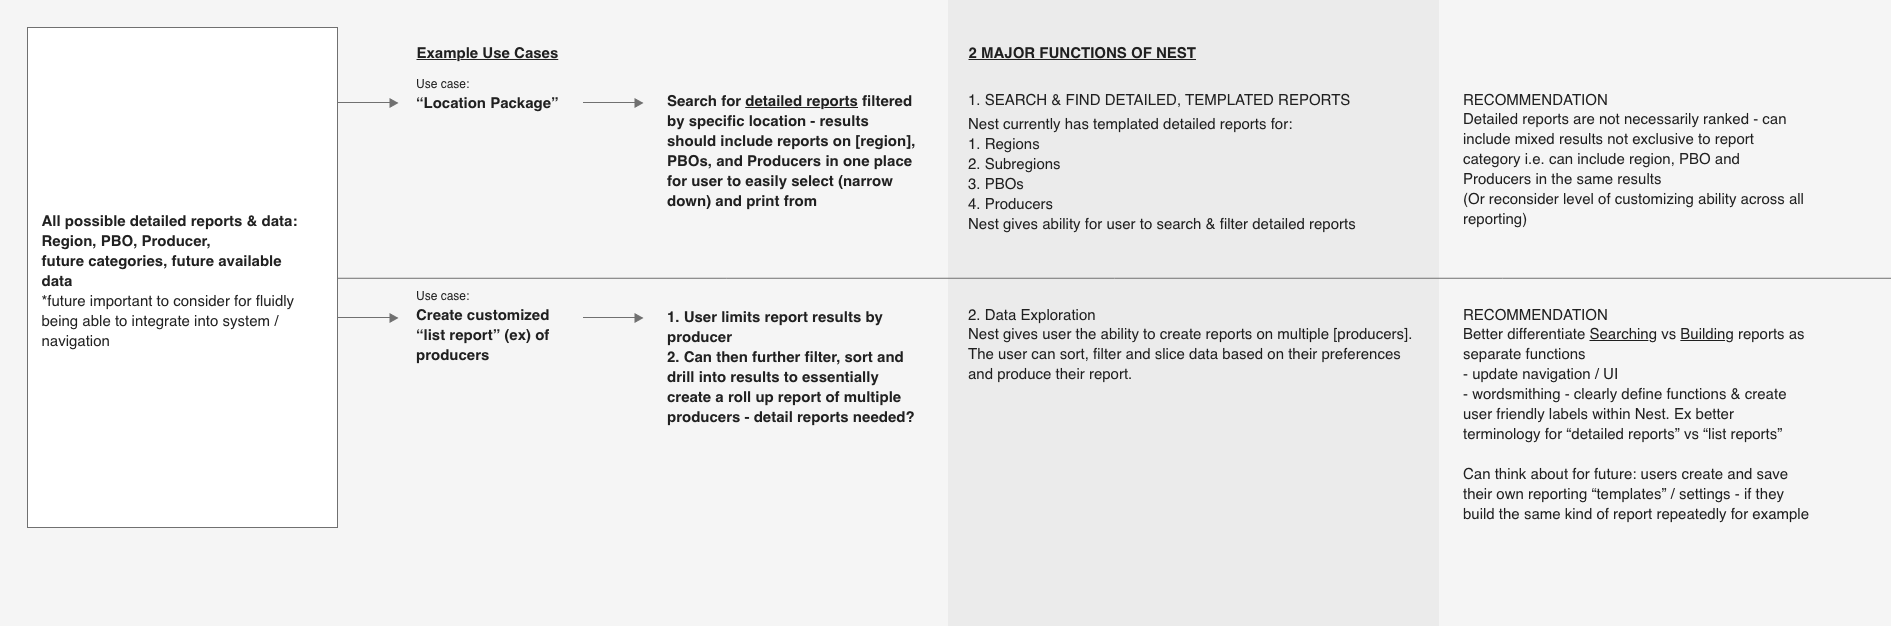
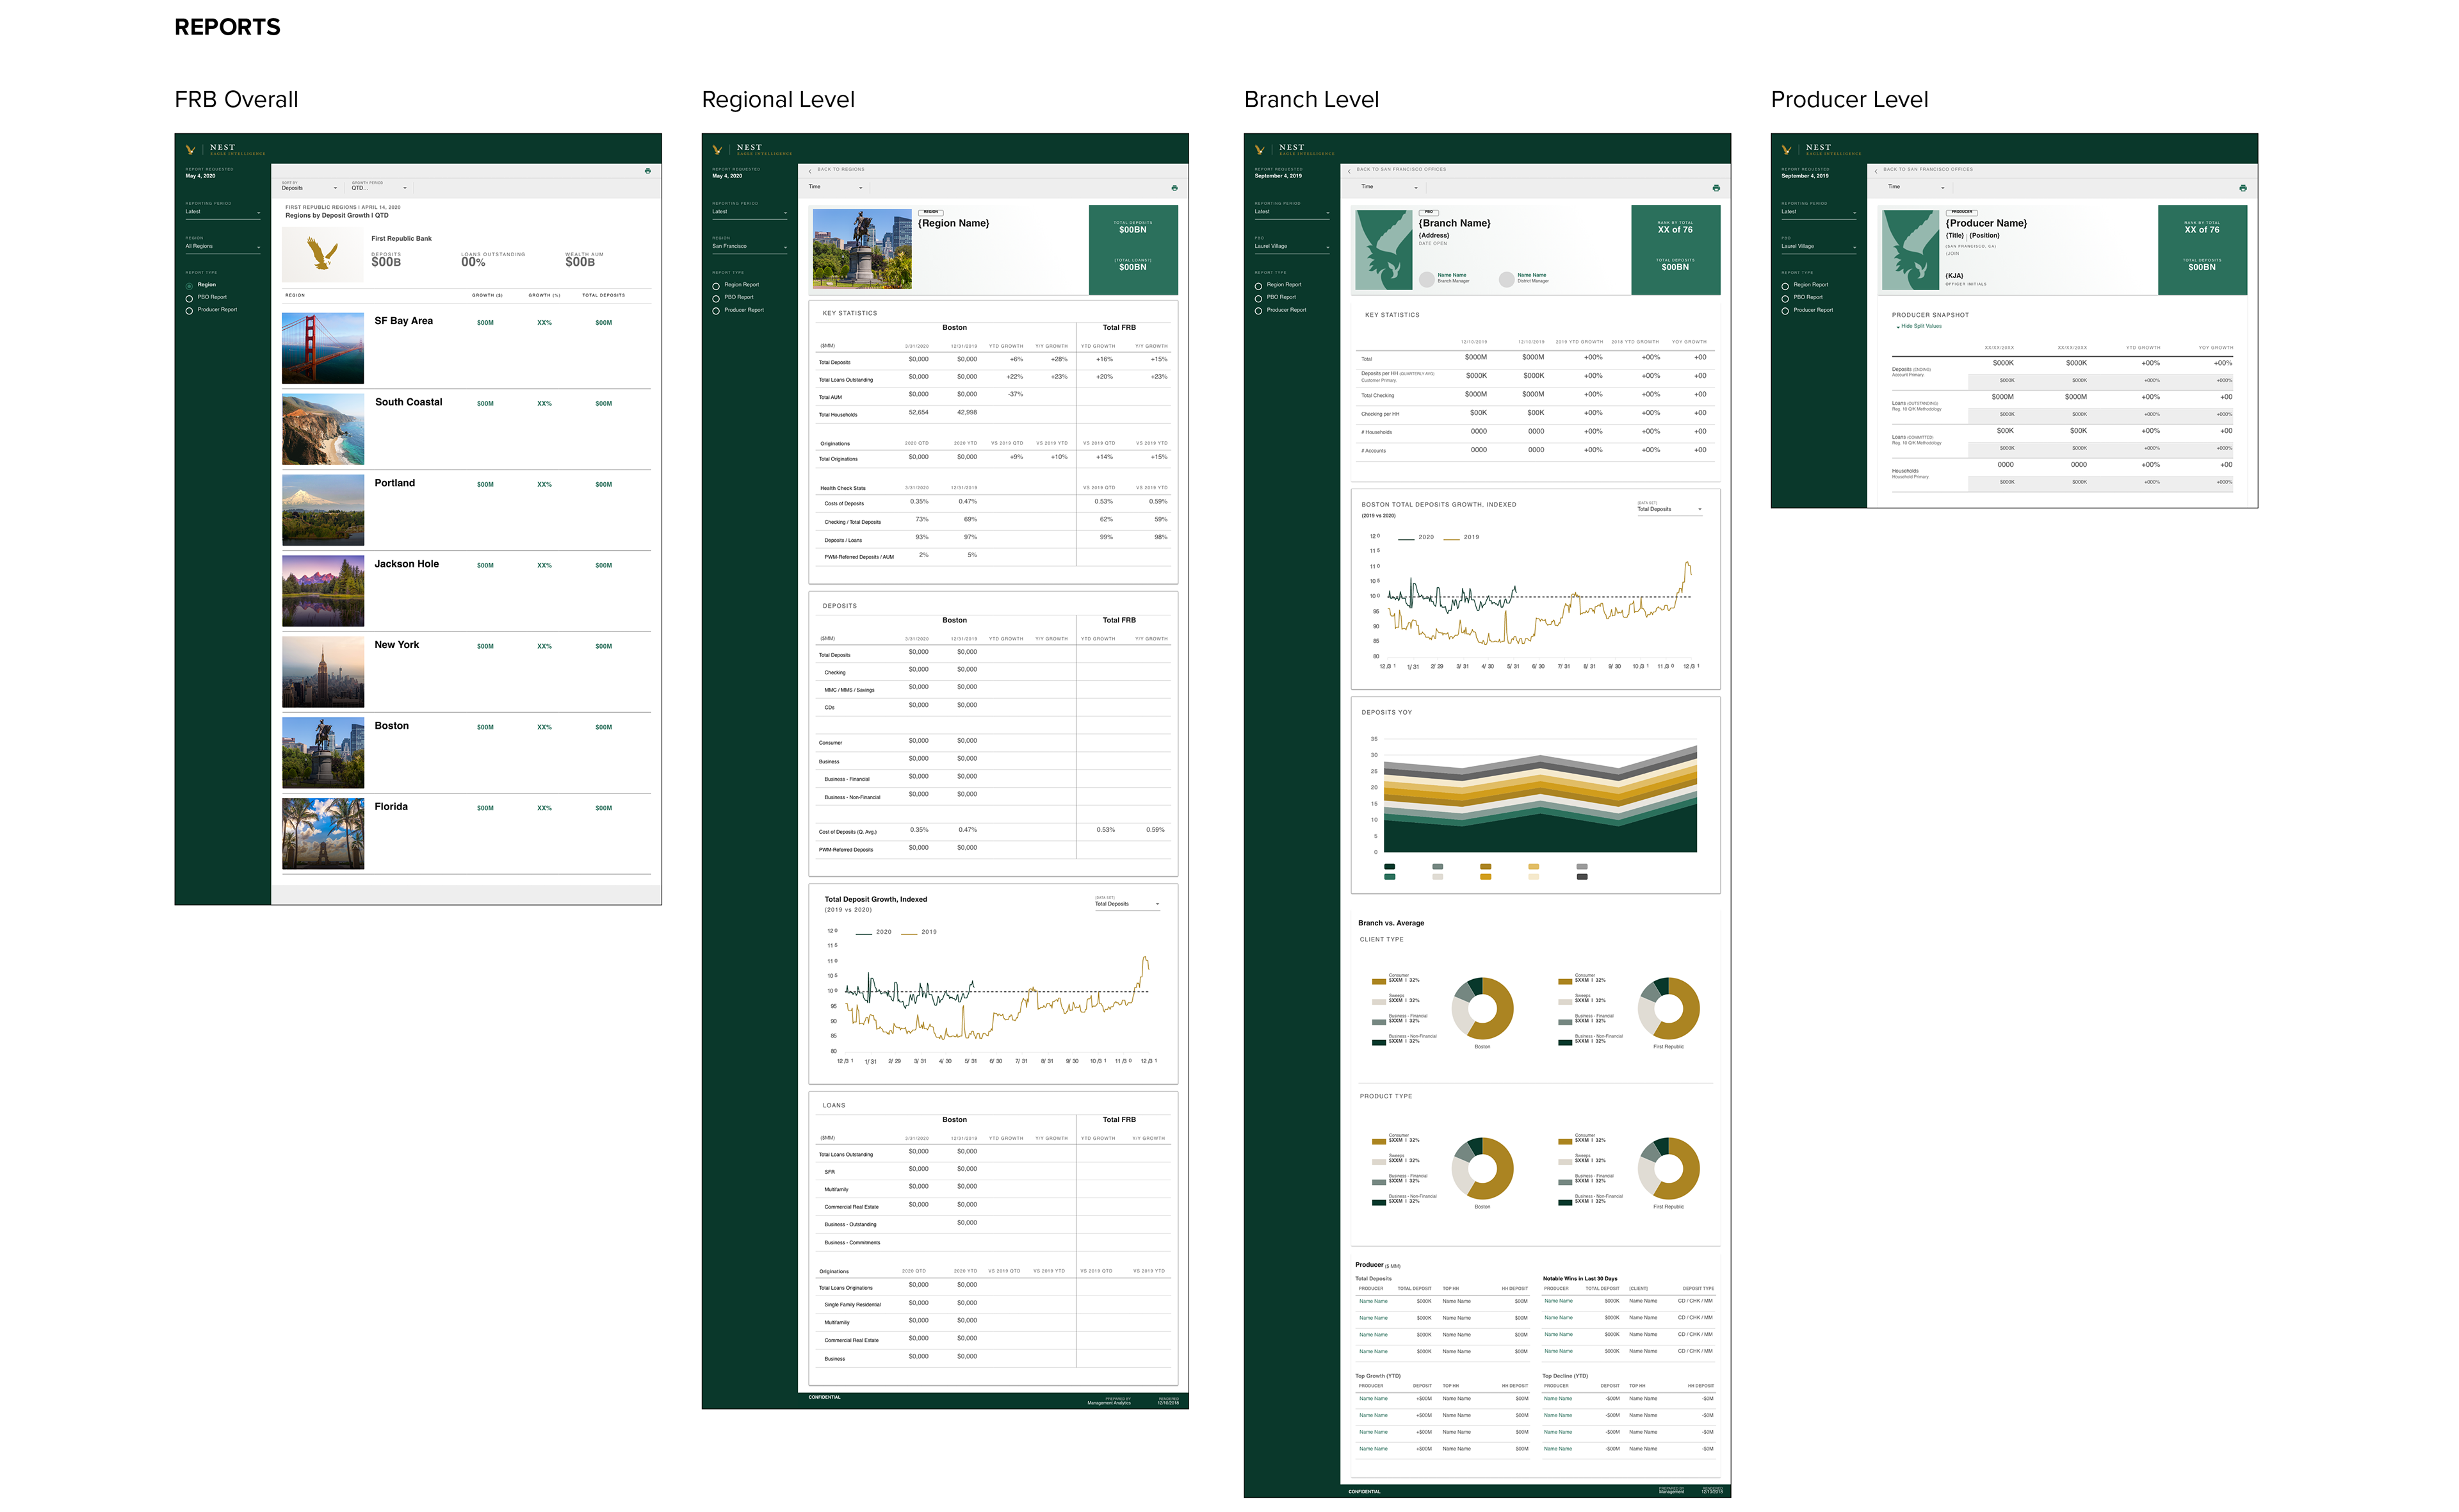
At First Republic Bank, I led the design of an internal business intelligence reporting tool aimed at streamlining data retrieval and standardizing reporting across the organization. This tool generated three types of reports—regional, branch-level, and banker-level—to provide insights at varying levels of granularity. By automating repetitive data pulls and ensuring consistency in reporting, the tool empowered executive management, analytics teams, and regional managers with quick, reliable, and standardized access to critical business metrics.
Role
UX Designer
UX Designer
Project Duration
June 2018 - September 2019
Problem
The analytics team at First Republic Bank frequently handled data requests pulling similar datasets for similar types of reports. This manual process was not only time-consuming but also repetitive.
To address these challenges, we needed a centralized reporting tool that would:
- Automate routine report generation tasks
- Standardize reporting across teams
- Enable end-users (executives, managers, and analysts) to access key insights without relying on manual data retrieval
- Automate routine report generation tasks
- Standardize reporting across teams
- Enable end-users (executives, managers, and analysts) to access key insights without relying on manual data retrieval
User Research
Our application was built for leadership and analytics teams. During the beta phase, we conducted user interviews to understand real-world use cases, pain points, and opportunities for improvement.
Insights
1. Deposit Milestones & Producer Snapshots
- Users rely on Nest to cross-check deposit milestones daily, particularly at critical thresholds ($100M, $1B).
- The ability to track initial balances and producer splits was crucial, with a preference for viewing these details via tooltips.
- Requests for producer snapshots and balance reports are frequent, often needed within minutes of meetings.
2. Meeting & Event Preparation
- Users frequently pull data for regional meetings, investor discussions, and high-net-worth client events (e.g., “billion-dollar dinner”).
- Quick-access snapshots for producers and PBOs (Private Banking Officers) are essential for last-minute requests.
- Reports are often used to track performance across different regions (e.g., loan origination for SF).
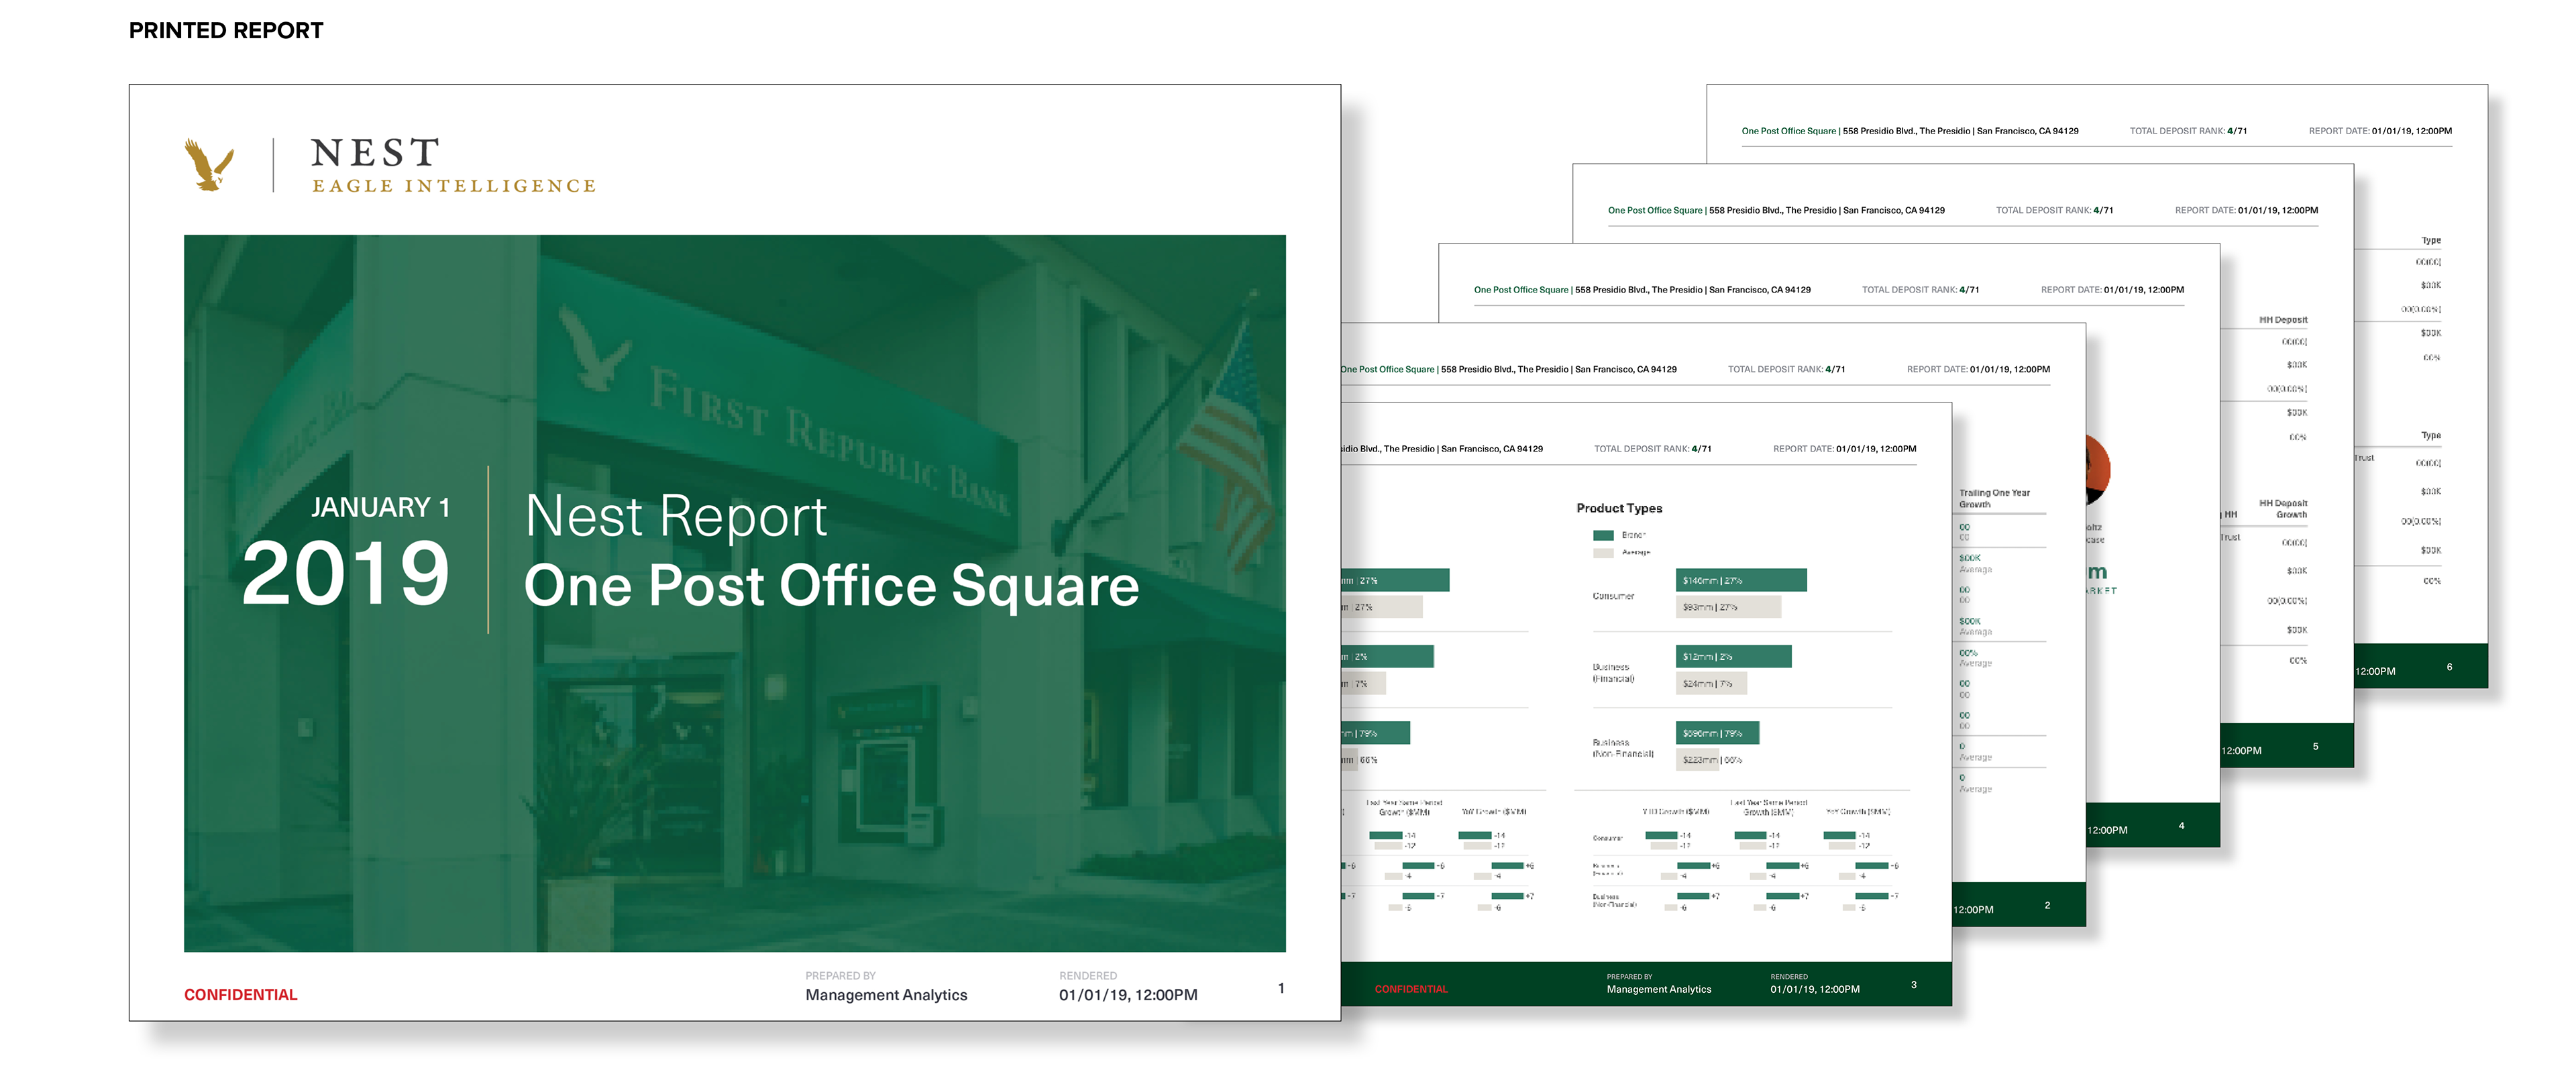
3. Printing & Report Generation
- Users require the ability to print full reports for meetings, including producer summaries and regional overviews.
- A “Print Region Book” feature would improve usability for multi-region comparisons.
- Users require the ability to print full reports for meetings, including producer summaries and regional overviews.
- A “Print Region Book” feature would improve usability for multi-region comparisons.
4. Mobile Usability & Accessibility
- The application is not fully optimized for mobile use, making it difficult to retrieve data on phones or tablets.
- Users expect seamless, instantaneous data retrieval, especially during in-person meetings.
- Browser compatibility issues (Edge) need to be addressed.
- The application is not fully optimized for mobile use, making it difficult to retrieve data on phones or tablets.
- Users expect seamless, instantaneous data retrieval, especially during in-person meetings.
- Browser compatibility issues (Edge) need to be addressed.
Pain Points & Suggested Improvements
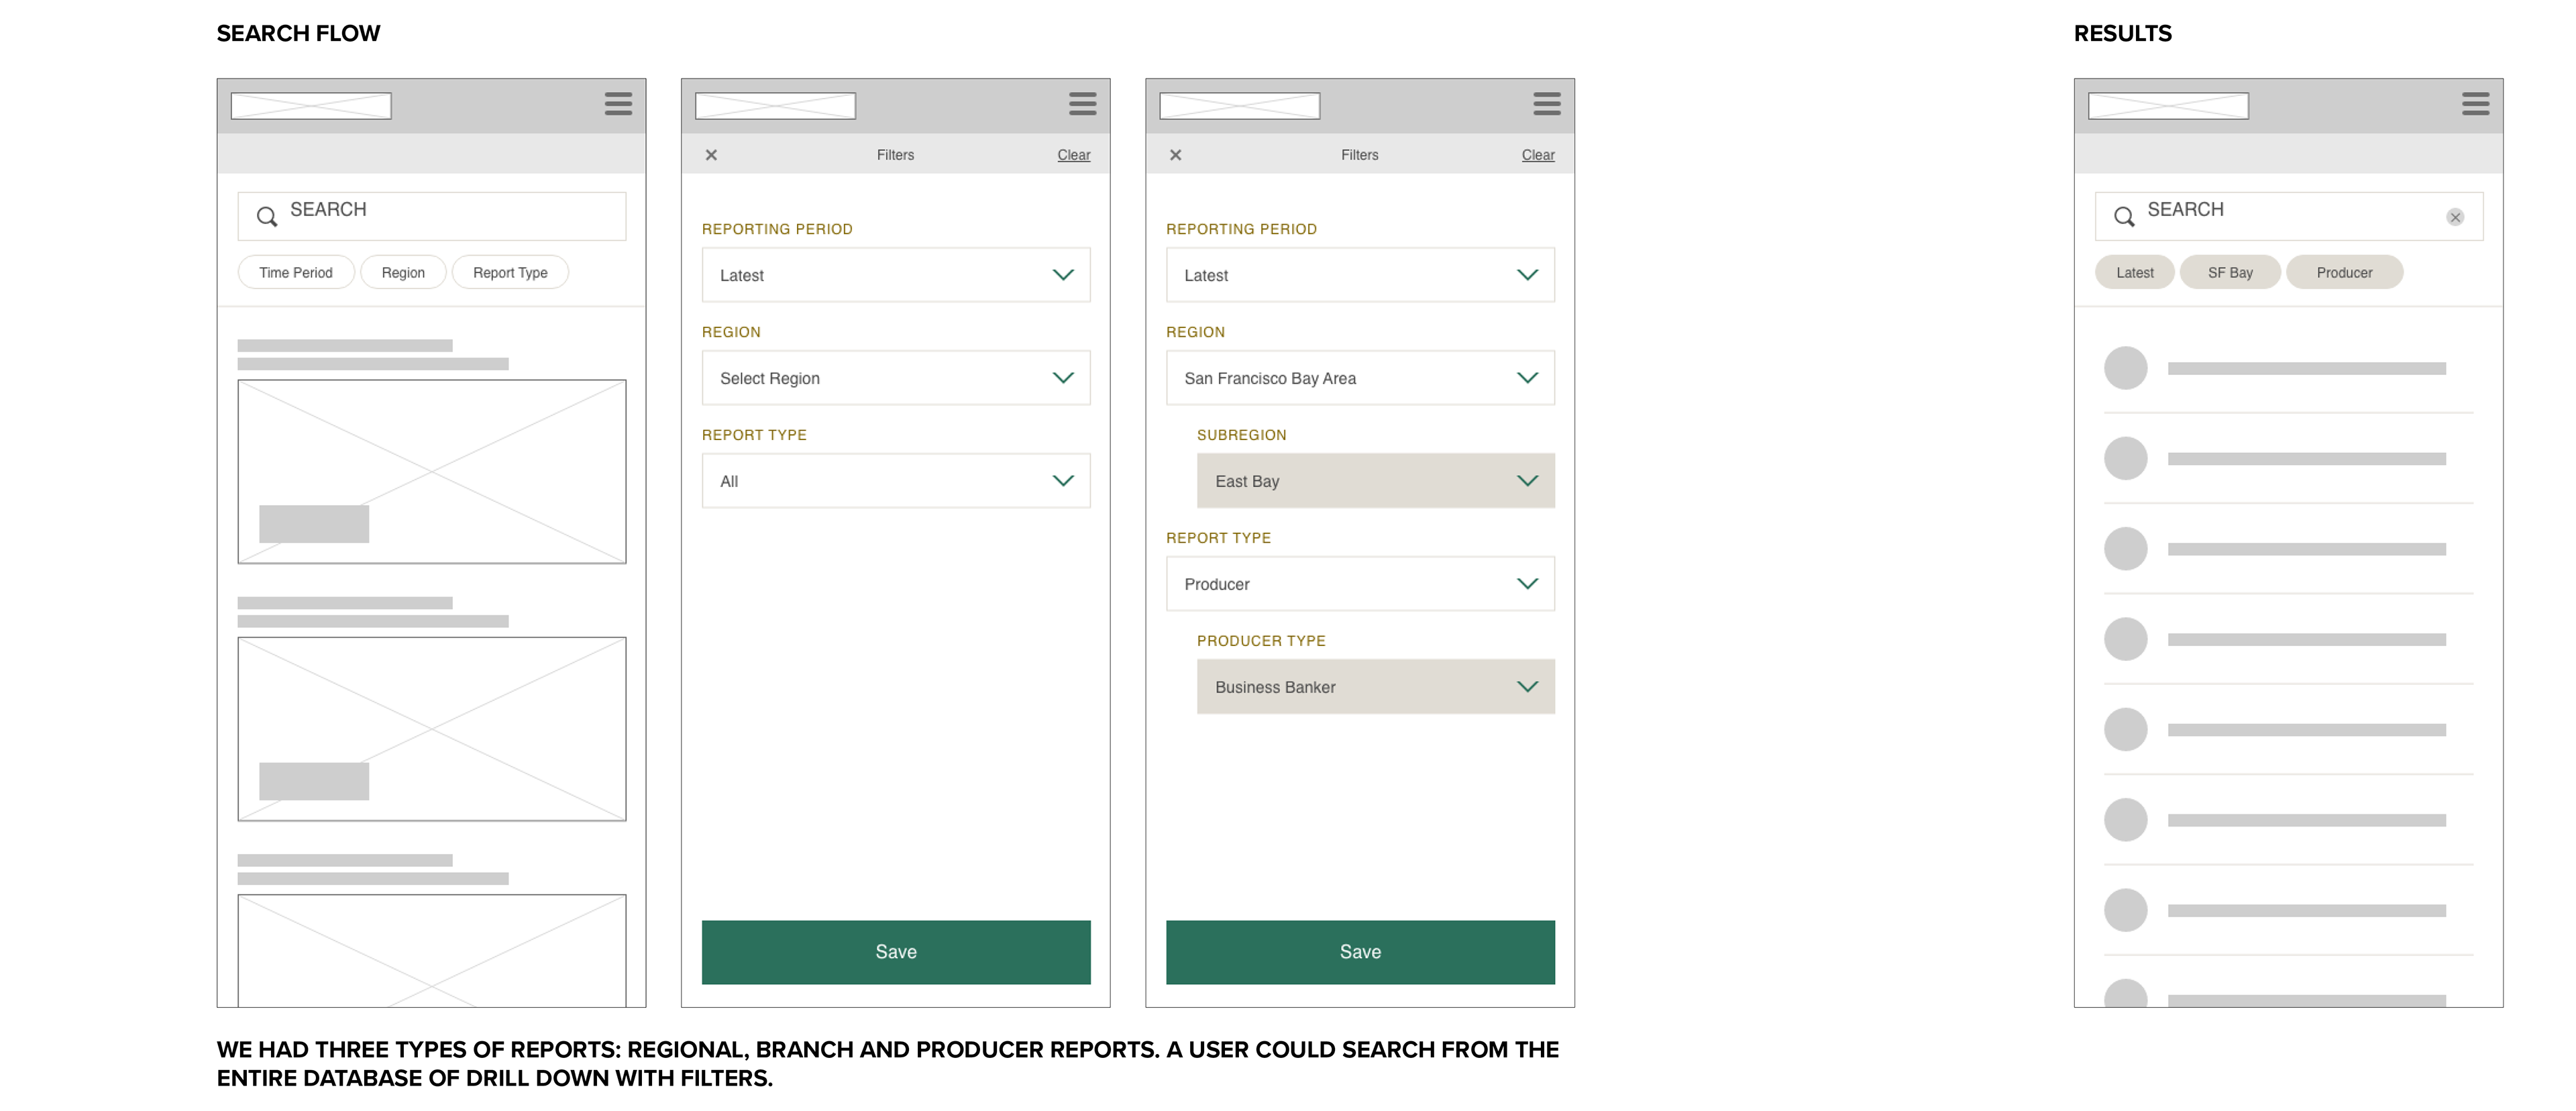
Sorting & Filtering: Users need better filtering options to sort producers by deposit size, particularly for those approaching key milestones.
Mobile Optimization: Improving the mobile experience (iPhone, iPad) would enhance accessibility for on-the-go usage.
Printing Enhancements: More robust printing capabilities, including regional summaries, producer lists, and milestone highlights.
Data Retrieval Speed: Data needs to be instantly available, as last-minute requests are common.
Search Functionality: Ability to search for PBOs by address (e.g., Embarcadero) and see milestone icons on producer lists.
Wealth Manager Page: A dedicated Wealth Manager producer page could streamline access to relevant data.
User Feedback & Adoption
Overall, users found Nest easy to navigate and quick to generate reports (~10 minutes for PDF exports).
There were no major complaints about the UI, but enhancements in filtering, printing, and mobile usability would improve adoption.
There were no major complaints about the UI, but enhancements in filtering, printing, and mobile usability would improve adoption.
User Profiles
1. Executive Management & Leadership Teams
Needs: High-level, strategic insights into regional and bank-wide performance. Quick access to standardized, reliable reports for decision-making.
Reports Used: Regional performance reports, key financial metrics, and growth trends.
Pain Points: Previously relied on manually pulled reports, which were inconsistent and delayed.
2. Regional & Branch Managers
Needs: Granular insights into branch and banker performance to guide strategy, optimize operations, and track targets.
Reports Used: Branch-level reports, individual banker performance reports.
Pain Points: Difficulty accessing up-to-date and standardized reports across branches.
Needs: Granular insights into branch and banker performance to guide strategy, optimize operations, and track targets.
Reports Used: Branch-level reports, individual banker performance reports.
Pain Points: Difficulty accessing up-to-date and standardized reports across branches.
3. Analytics & Data Teams
Needs: A self-service reporting tool to reduce the burden of repetitive data requests and ensure accuracy in reporting.
Reports Used: Customizable reports with standardized data sources for consistency.
Pain Points: Spent significant time pulling redundant data requests manually, often dealing with data discrepancies across reports.
Conceptualization
The Solution
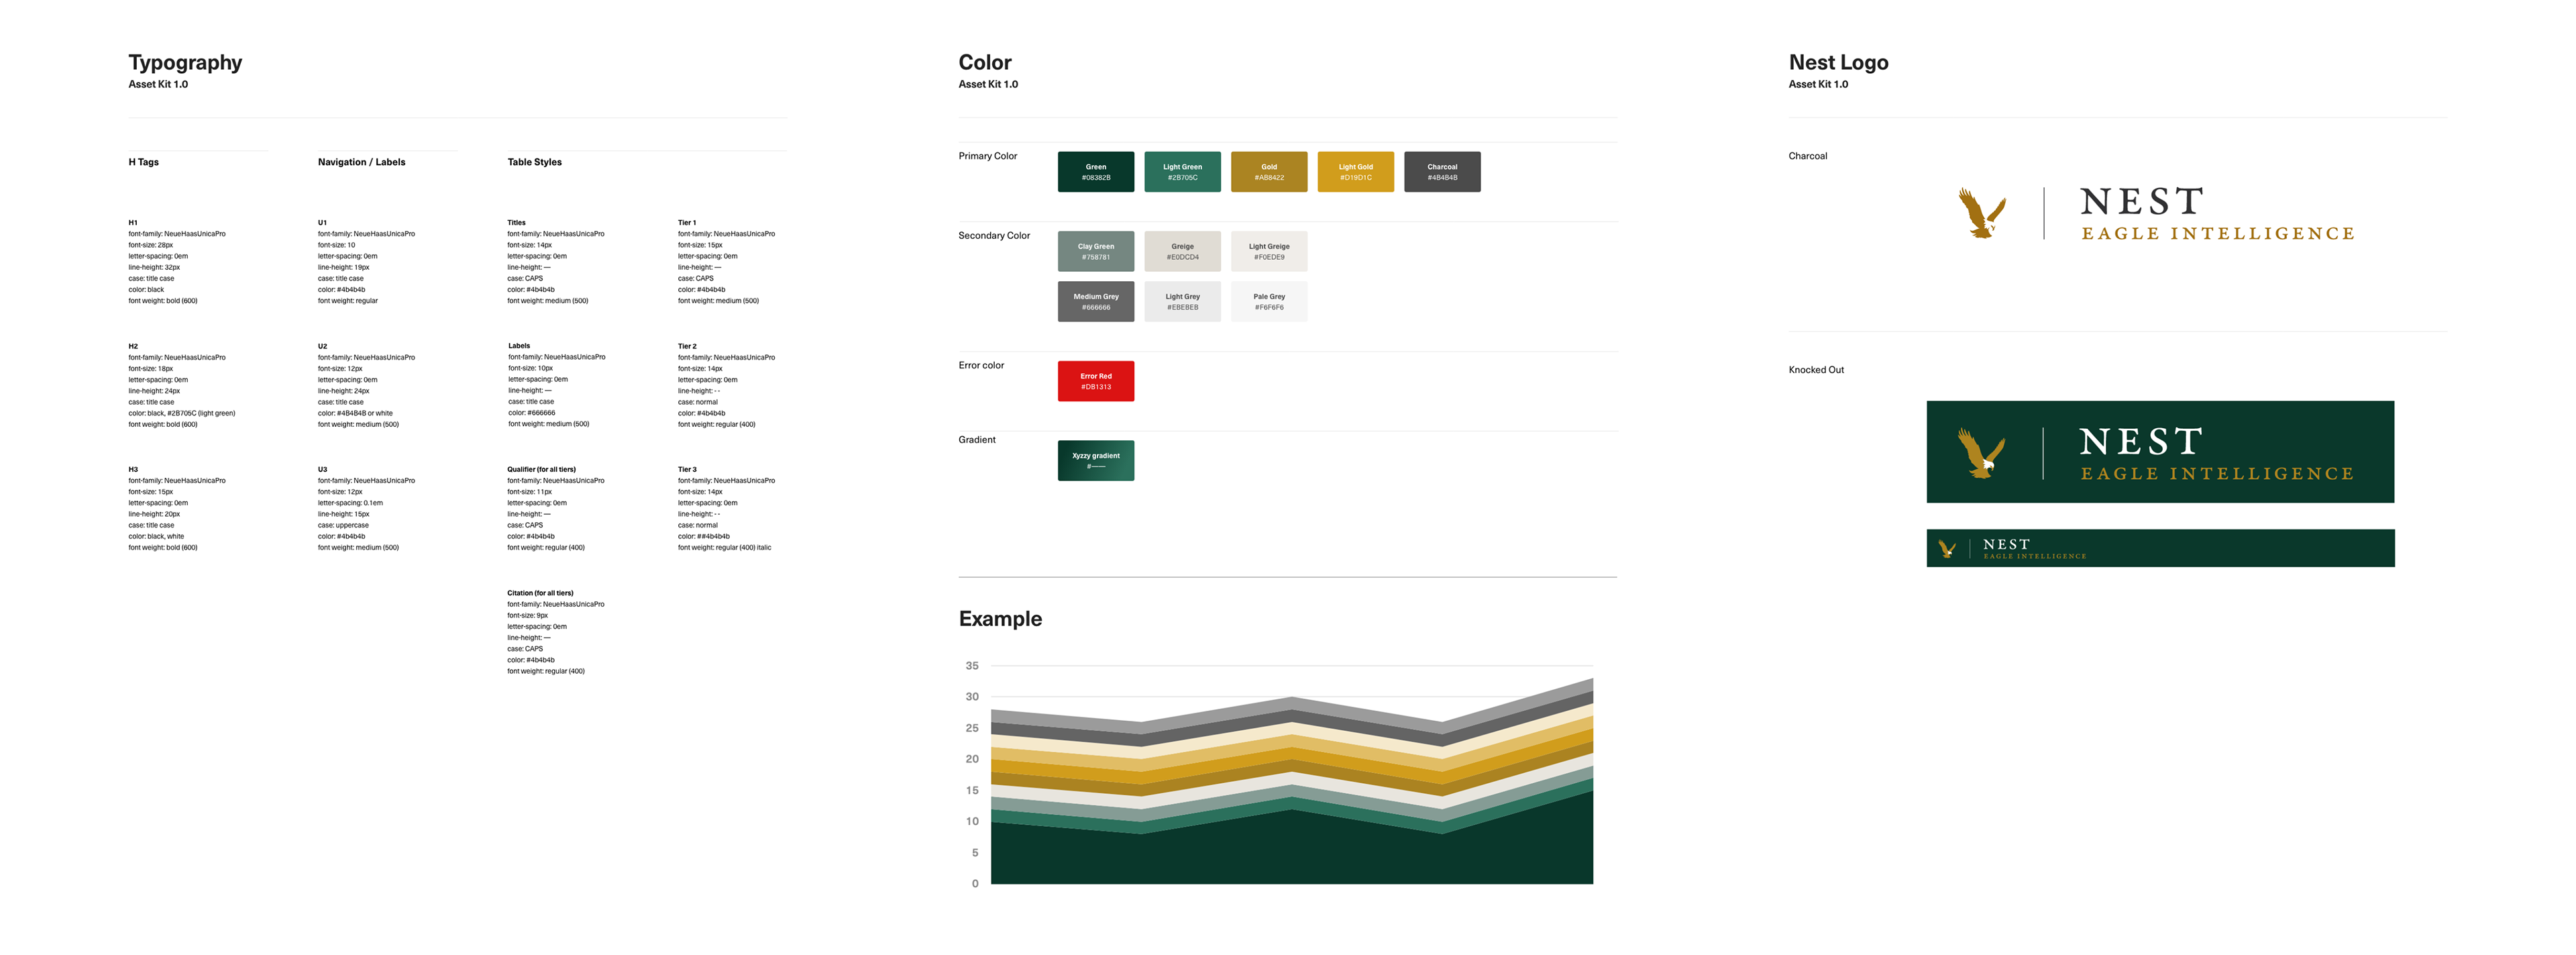
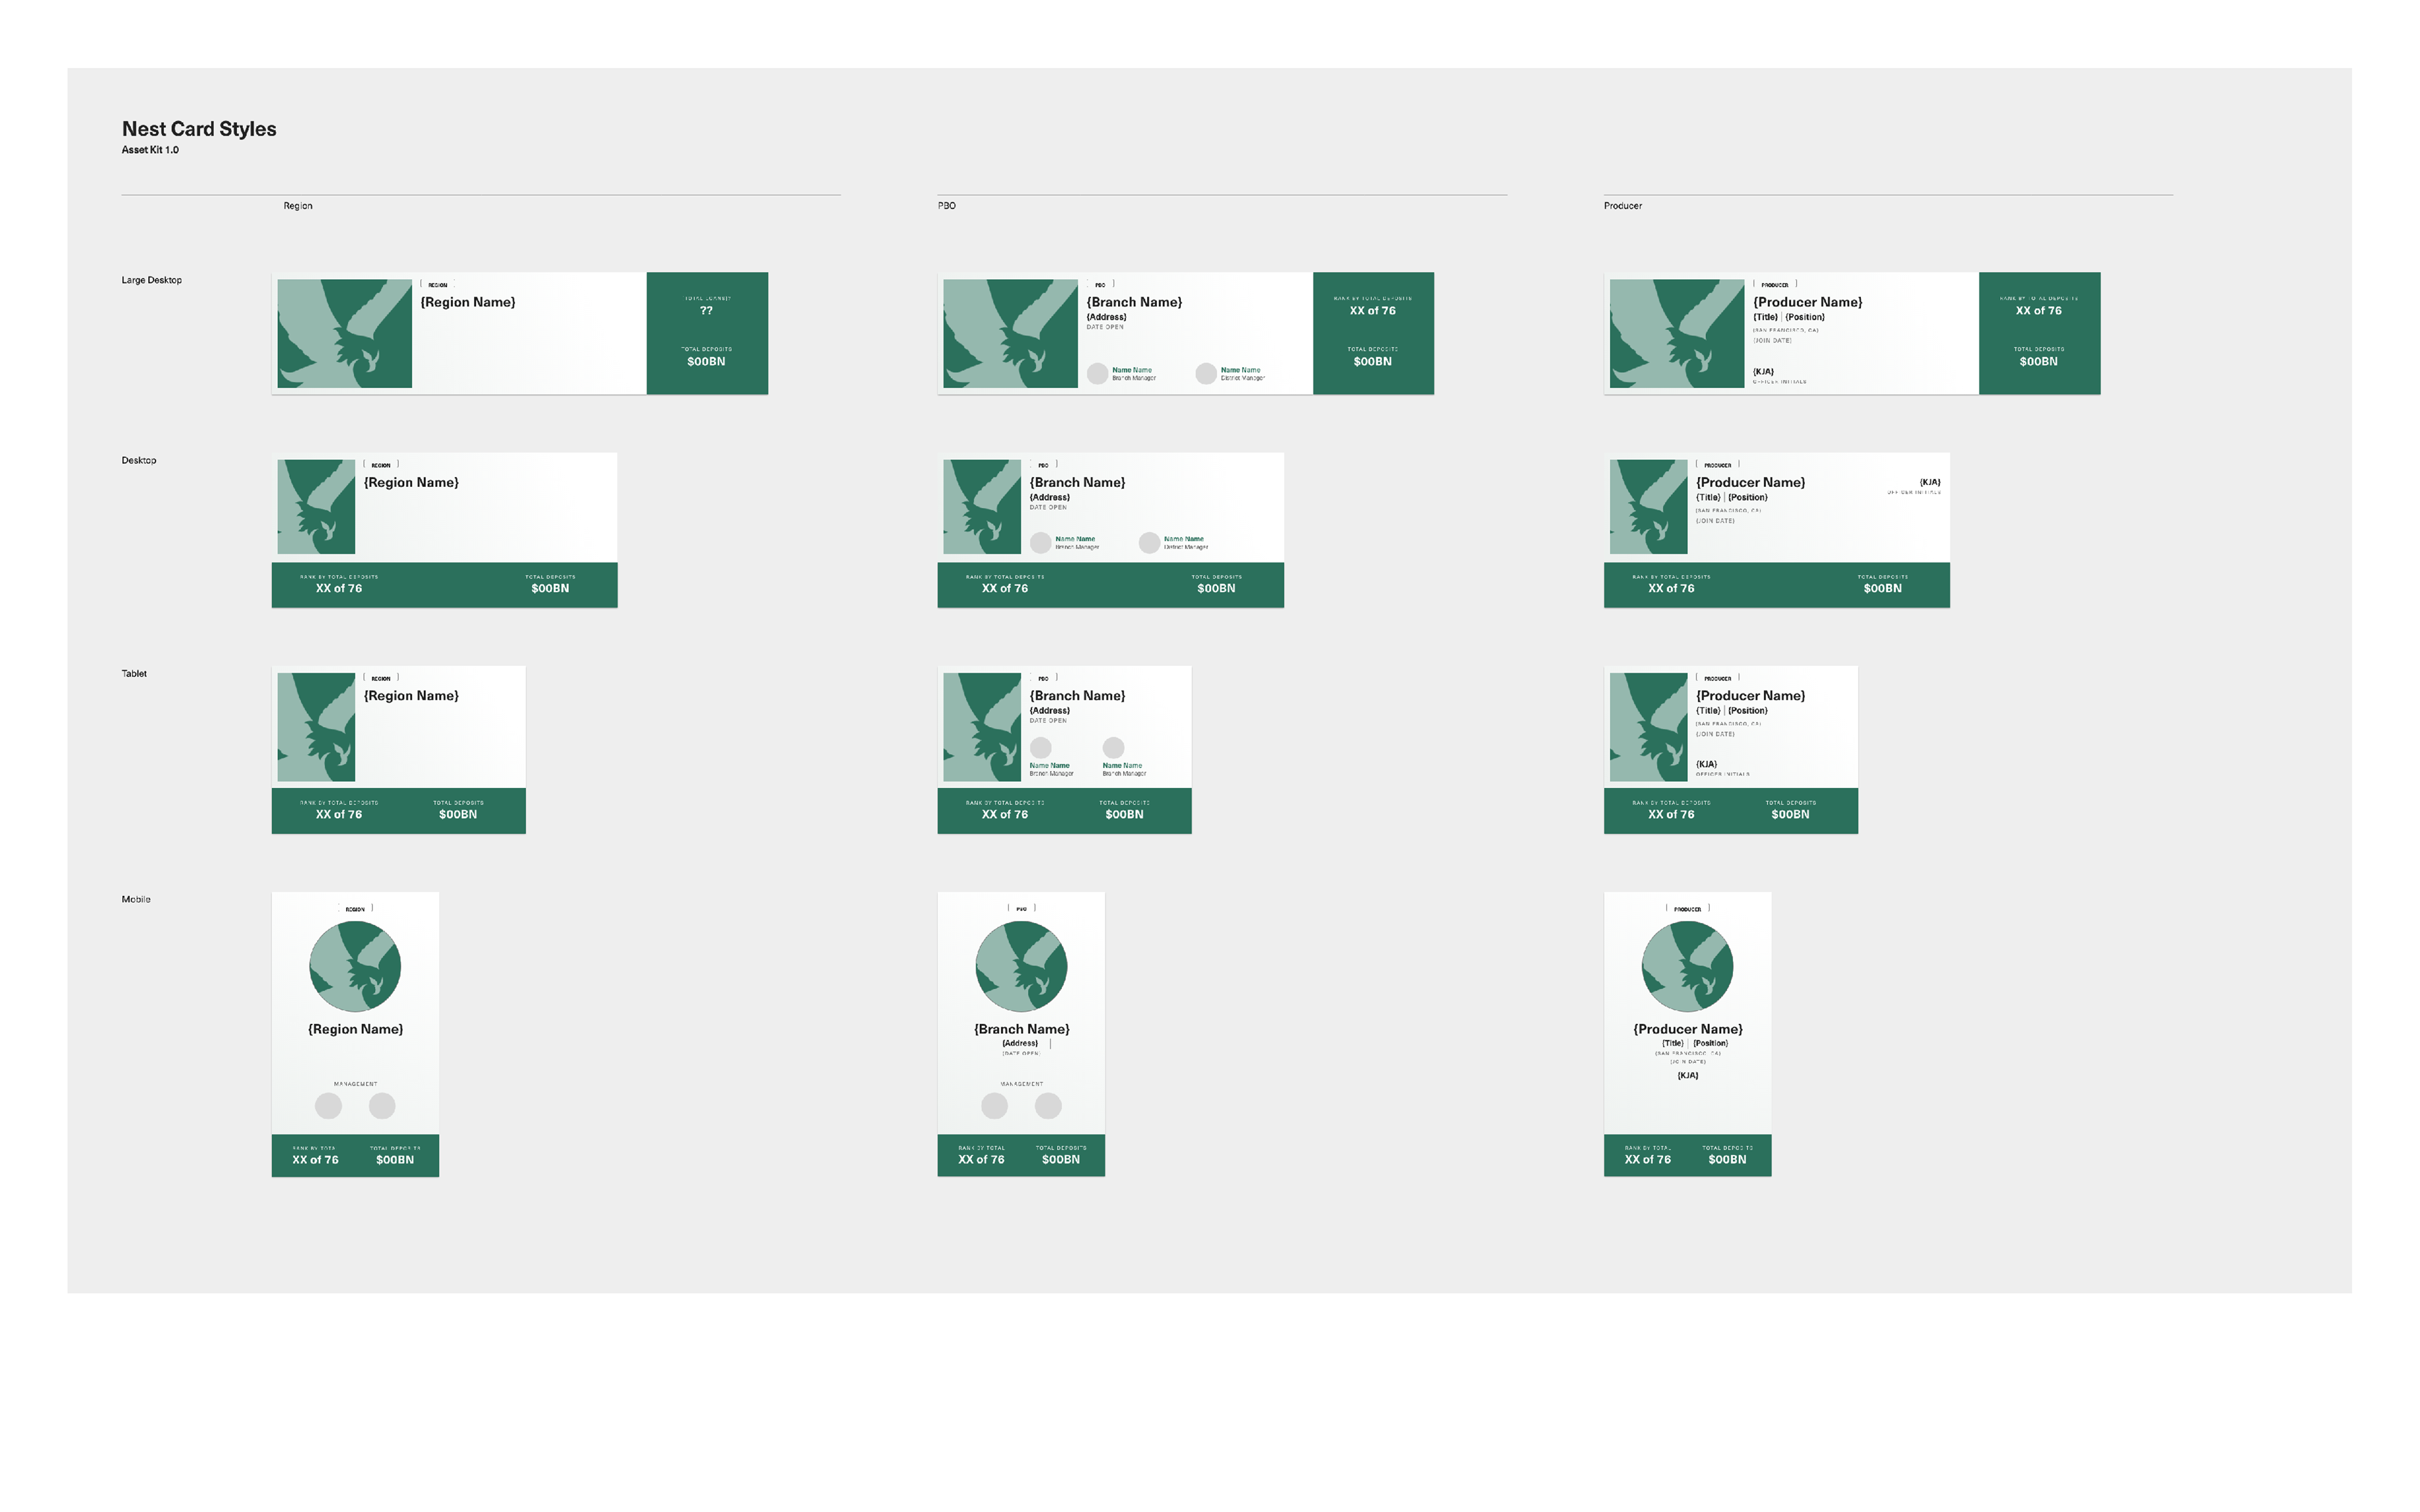
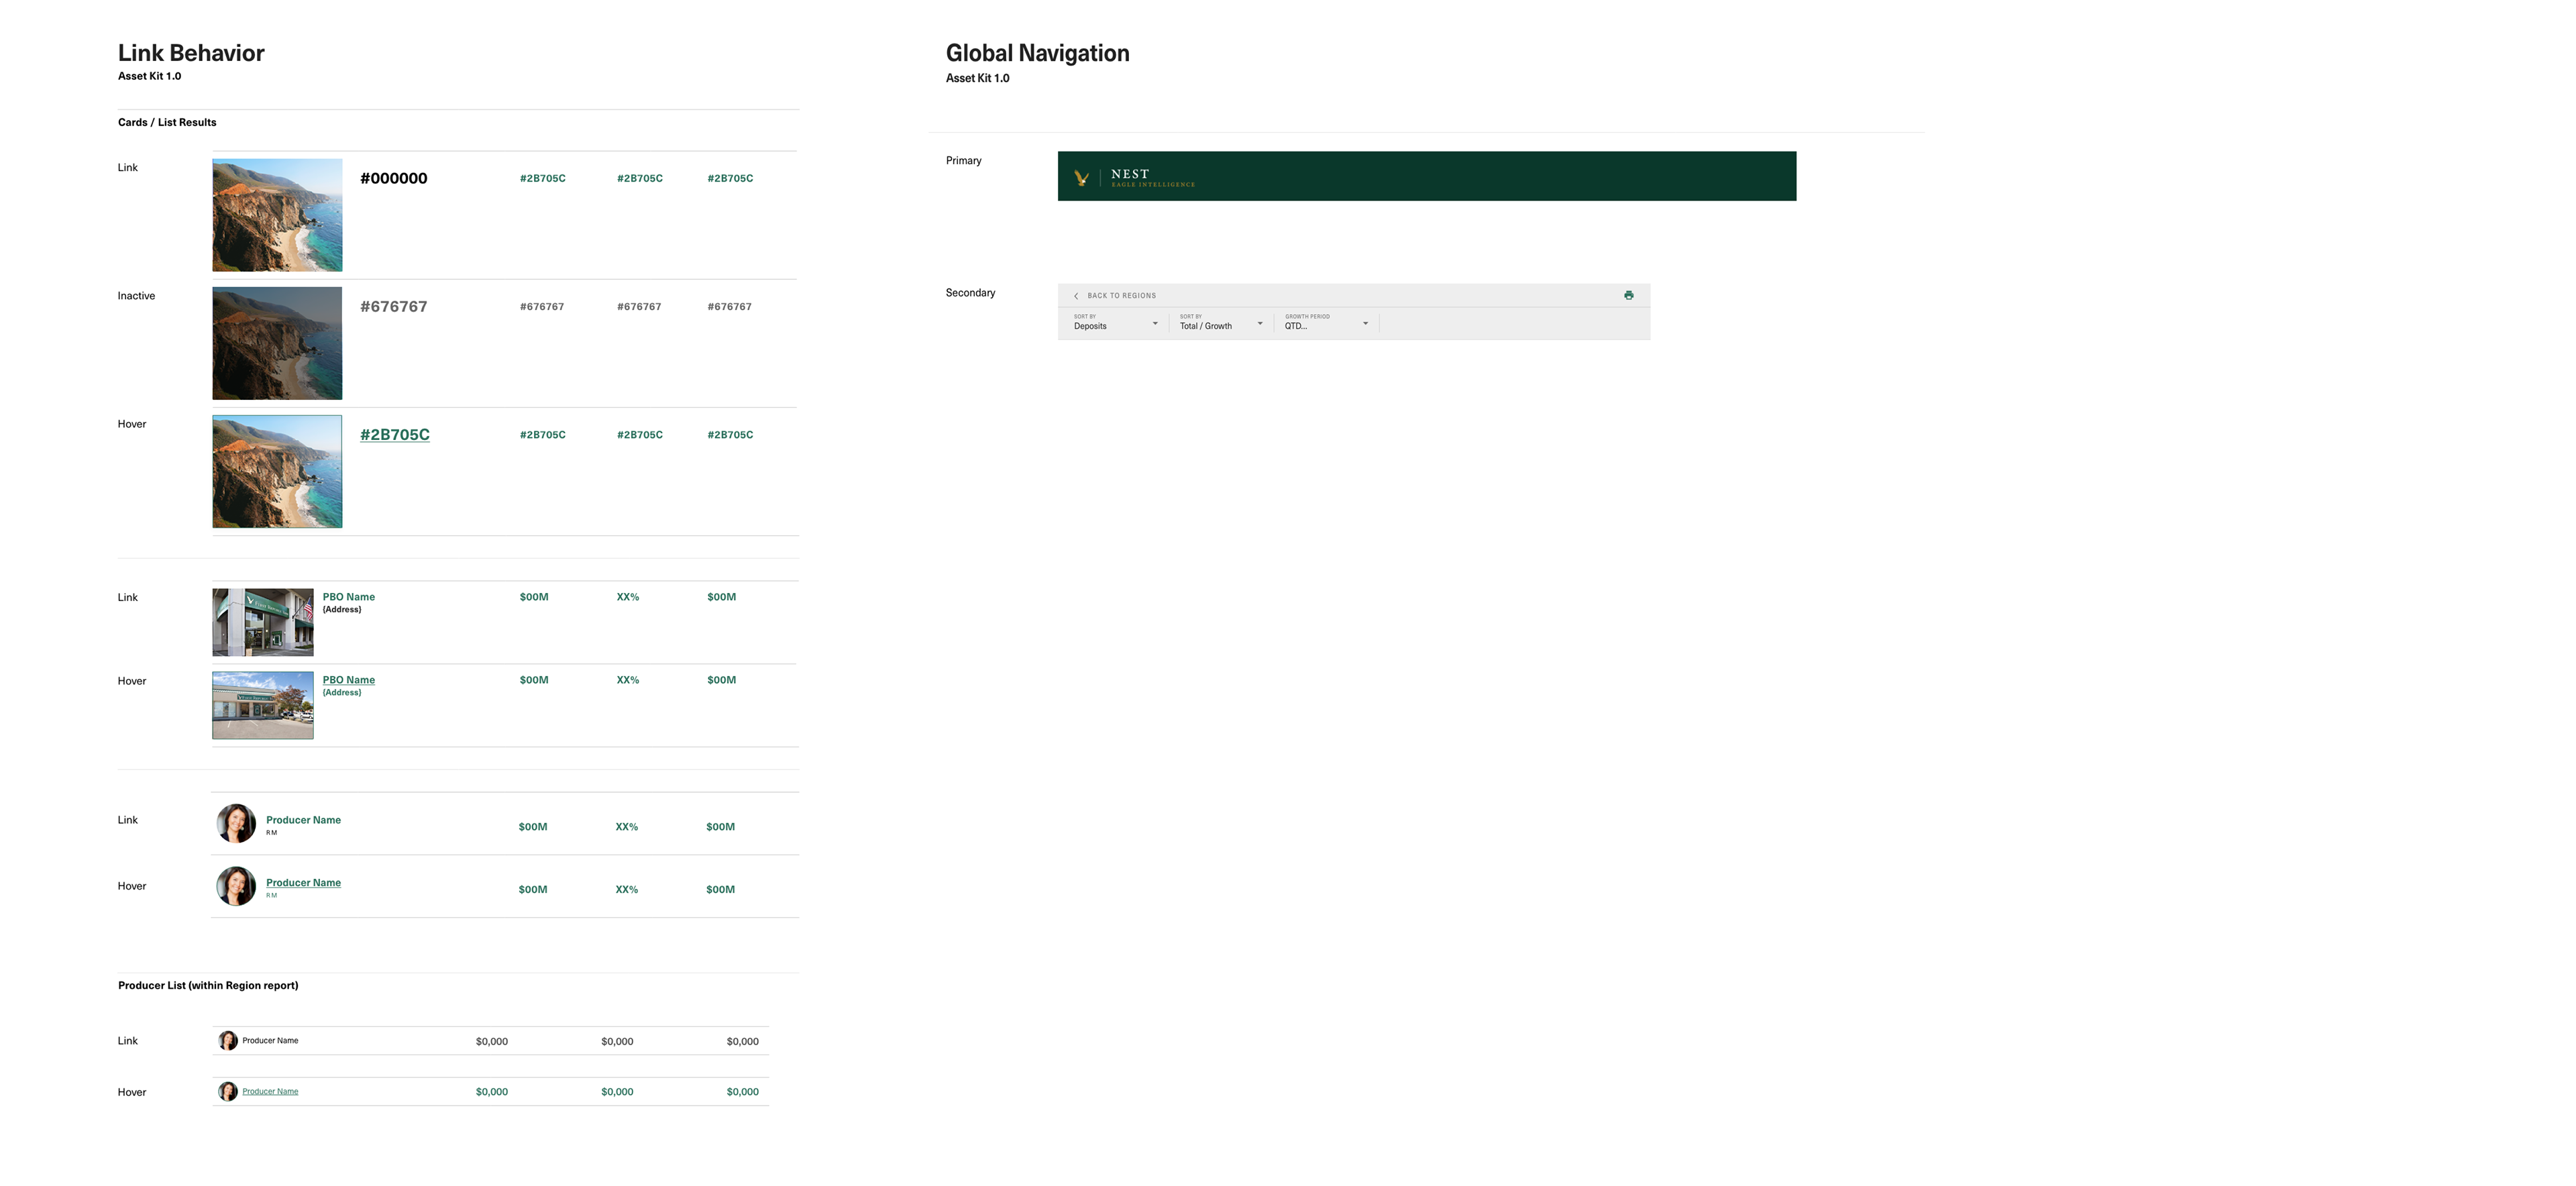
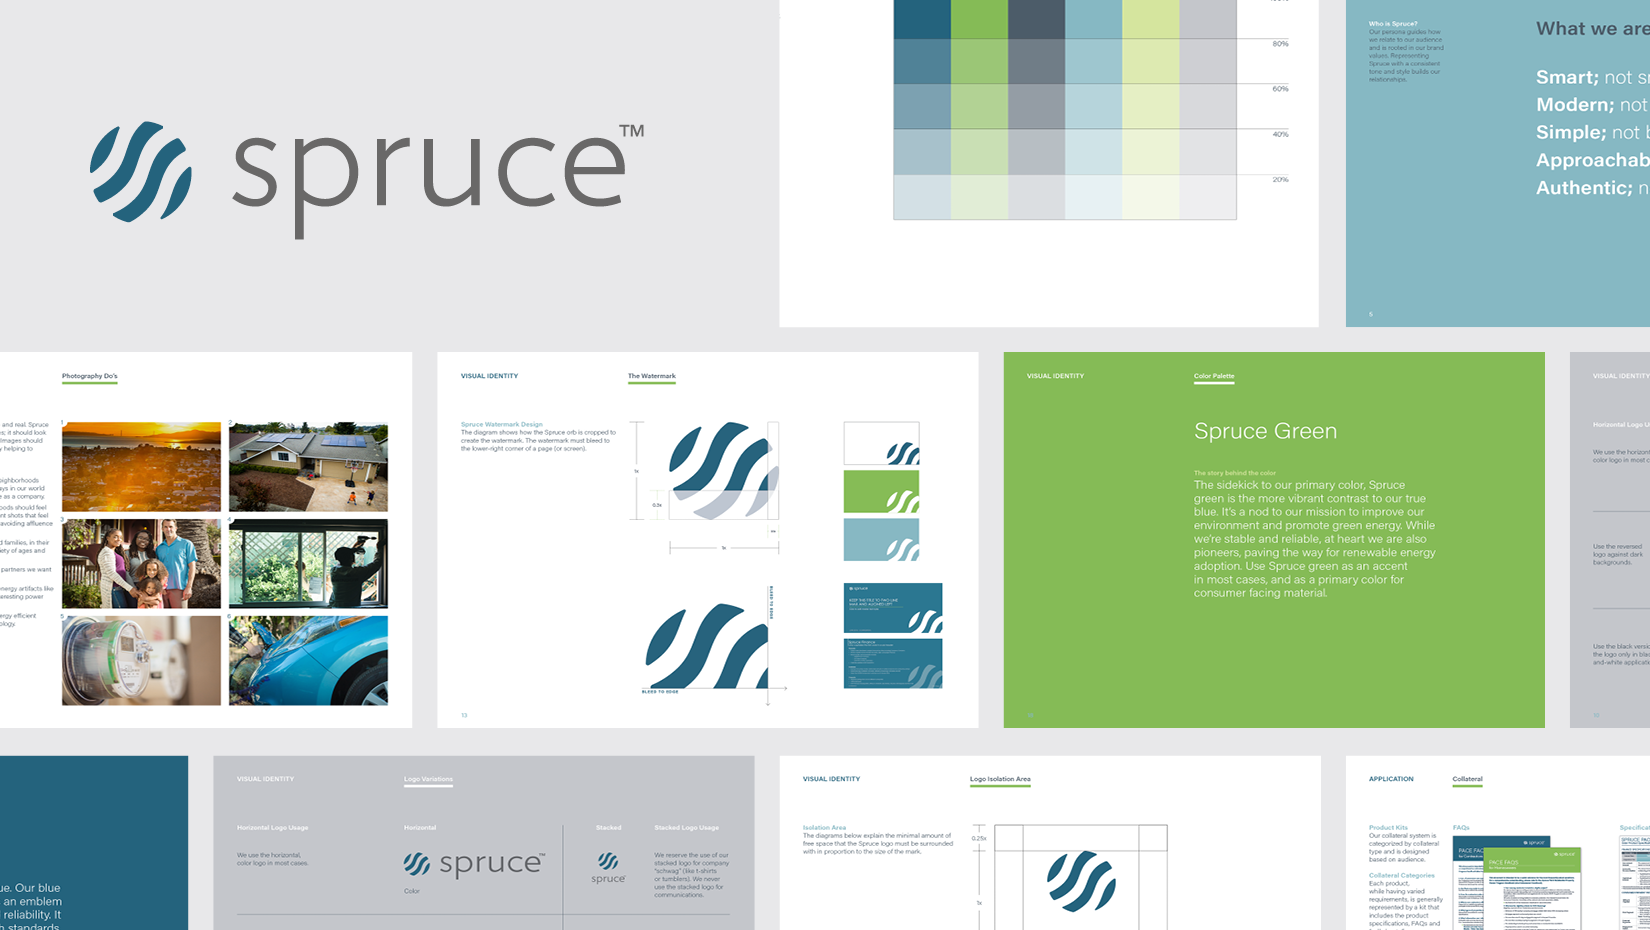
Design System